


Project Overview
This project demonstrates a complete IoT monitoring system that collects real-world sensor data and displays it in a professional dashboard. The system uses a Raspberry Pi with a temperature and humidity sensor to gather environmental data, which is then processed, stored, and visualized through a web-based interface.
How It Works
The workflow is straightforward: A Raspberry Pi equipped with a DHT11 temperature and humidity sensor periodically takes readings from its environment. A Python script on the Pi sends these readings to an Express.js REST API server running in the cloud. The API processes the incoming data and stores it in an InfluxDB time-series database. Finally, Grafana connects to the database and displays the sensor readings in a customizable, real-time dashboard that can be accessed from any web browser.
The Complete Data Pipeline
Data Collection: The Raspberry Pi runs a Python script that interfaces with the DHT11 sensor to capture temperature (in Fahrenheit) and humidity measurements.
Data Transmission: The Python script packages the sensor readings and sends them as HTTP requests to the Express.js API endpoint hosted on a DigitalOcean server.
Data Processing: The Express.js server receives the sensor data, validates it, and formats it into data points that InfluxDB can understand.
Data Storage: InfluxDB, a specialized time-series database running in a Docker container, stores the measurements along with timestamps, making it easy to query historical trends.
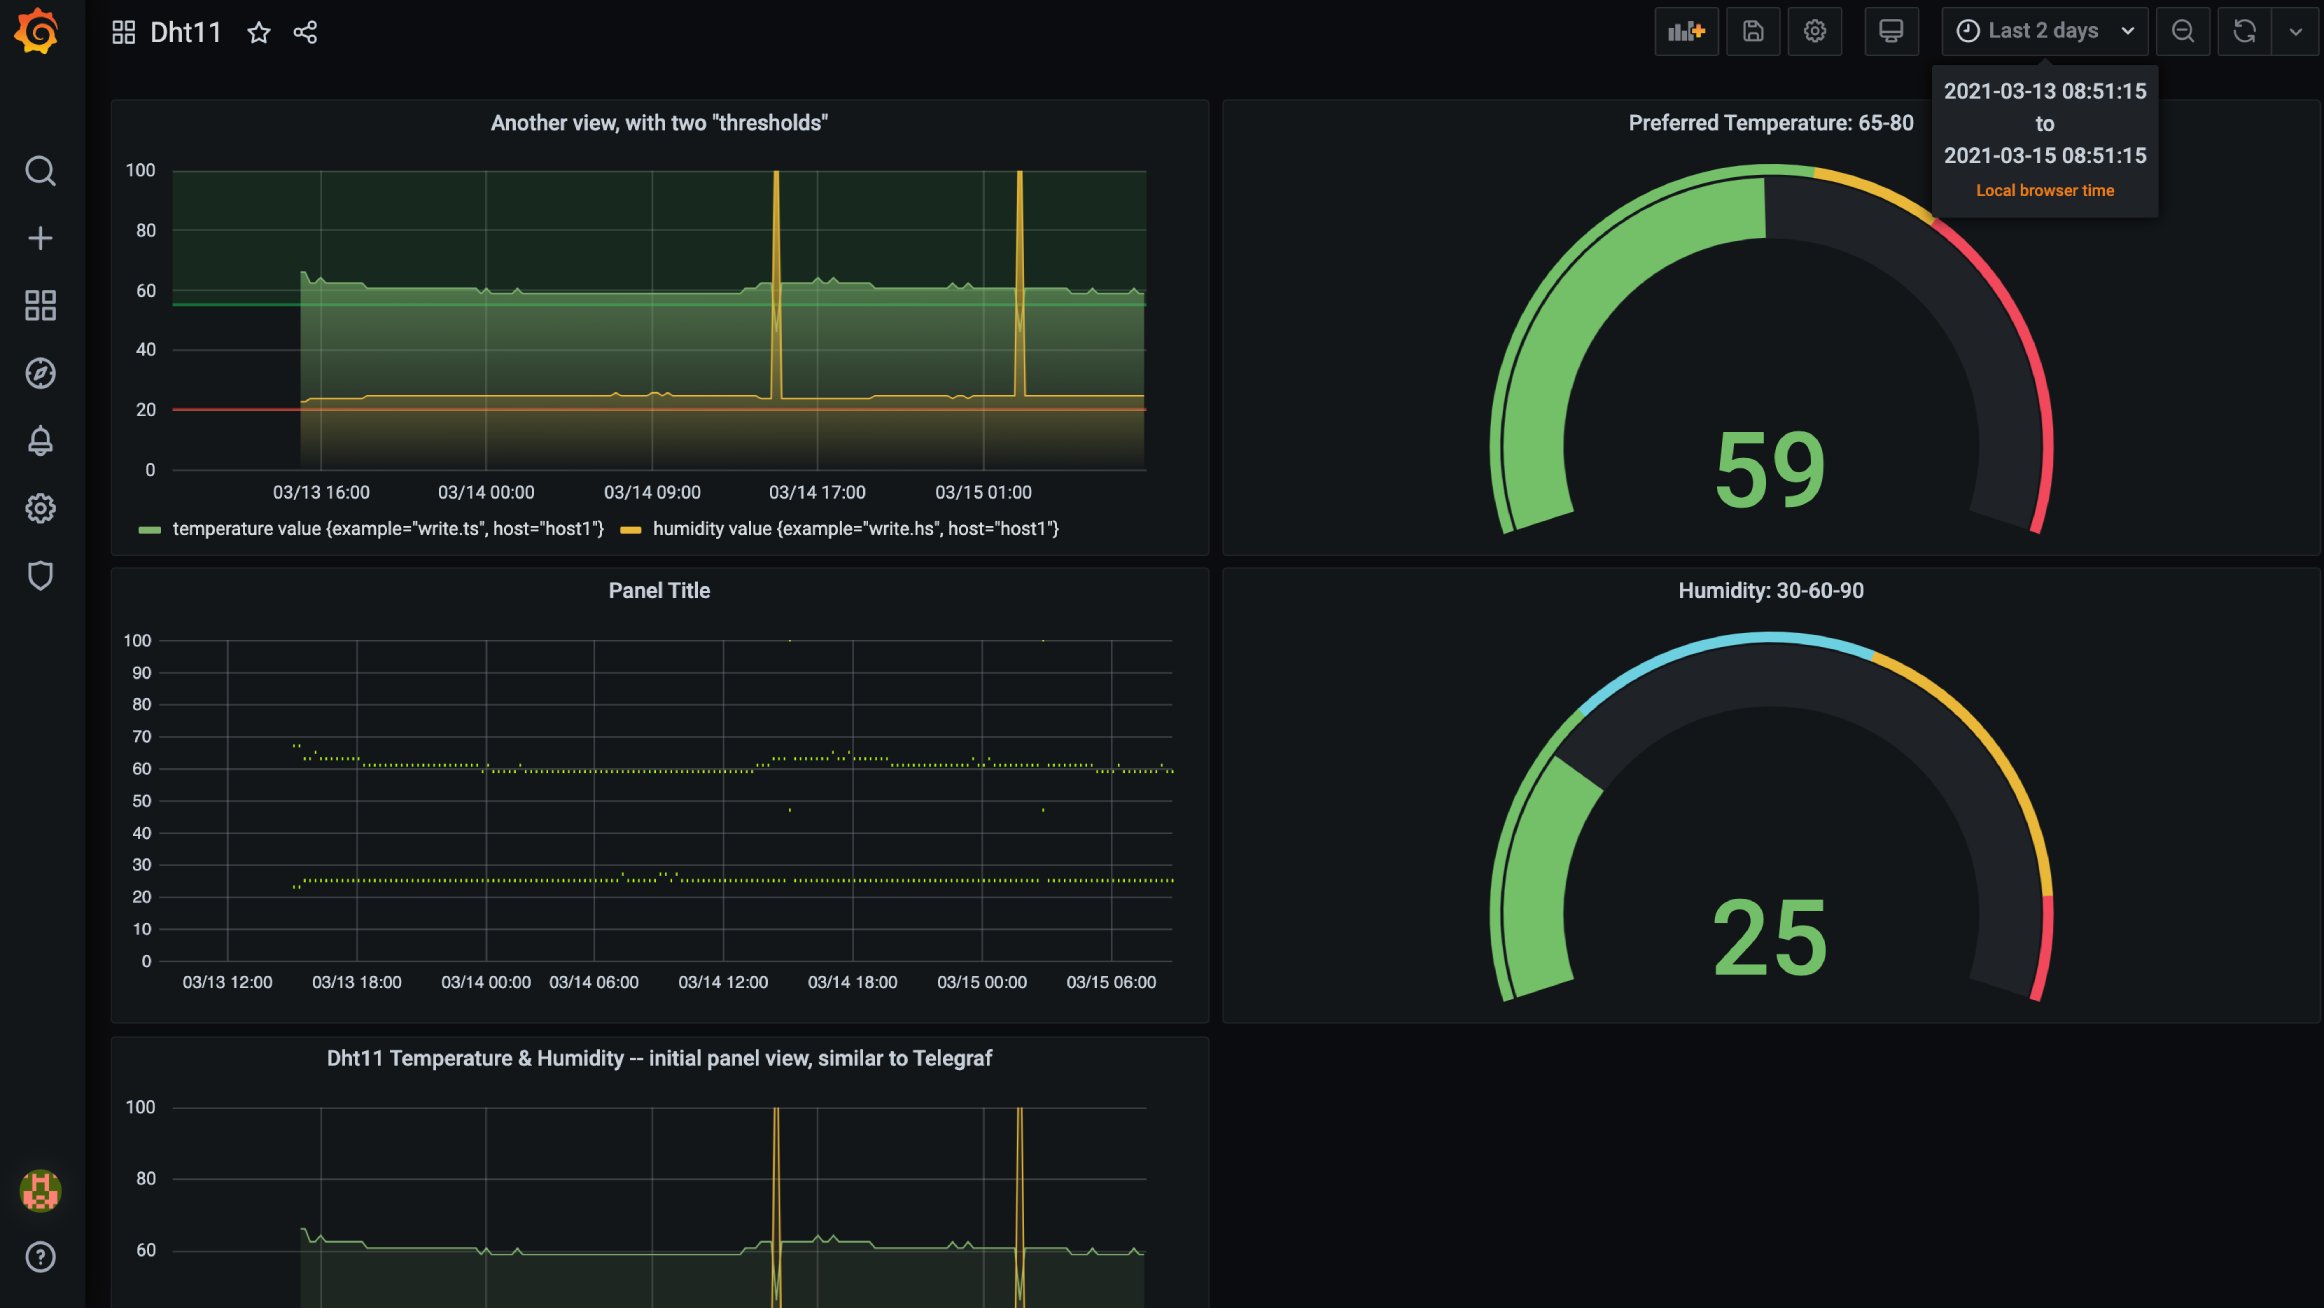
Data Visualization: Grafana, also running in a Docker container, connects to InfluxDB and provides a beautiful, customizable dashboard where you can see current readings and historical graphs of temperature and humidity over time.
Real-World Applications
This project serves as a foundation for more complex IoT monitoring systems. The same architecture could be adapted to monitor:
- Server room environmental conditions
- Home automation and climate control
- Agricultural greenhouses
- Industrial equipment temperature monitoring
- Weather station data collection
Technical Architecture
The system uses containerization (Docker) to isolate the database and visualization components, making the entire setup portable and easy to deploy. An Nginx reverse proxy handles incoming traffic and routes requests to the appropriate services. The modular design means each component can be updated or replaced independently without affecting the rest of the system.
Why This Stack
InfluxDB was chosen because it’s specifically designed for time-series data—measurements that happen over time, like sensor readings. It efficiently stores and queries this type of data.
Grafana provides professional-grade data visualization with minimal configuration. It can create compelling dashboards without requiring custom frontend development.
Express.js offers a lightweight, flexible API layer that’s easy to extend with additional endpoints or data processing logic.
Docker ensures consistent deployment across different environments and makes it simple to spin up or tear down the monitoring infrastructure.
Project Highlights
- End-to-end IoT data pipeline from physical sensor to web dashboard
- RESTful API design for scalable data ingestion
- Time-series database optimized for sensor data
- Professional visualization with zero custom frontend code
- Containerized deployment for portability and reliability
- Cloud-hosted for remote monitoring from anywhere
Use Case
This project was created as a demonstration of IoT monitoring capabilities, showing how relatively simple and inexpensive hardware (a Raspberry Pi and $5 sensor) can be connected to enterprise-grade data storage and visualization tools to create a production-ready monitoring system.
Technologies Used
- Raspberry Pi - Edge computing device
- DHT11 Sensor - Temperature and humidity measurement
- Python - Sensor data collection and transmission
- Express.js - REST API server
- InfluxDB - Time-series database
- Grafana - Data visualization and dashboards
- Docker - Containerization
- Nginx - Reverse proxy and web server
- DigitalOcean - Cloud hosting