
Project Overview
As part of my graduate statistics course “Advanced Statistical Methods”, I built a predictive model using R to answer a specific research question: To what degree can a neighborhood’s crime rates be predicted with economic factors?
Specifically, I investigated whether crime per capita in Austin, TX zipcodes could be predicted using three economic indicators: percentage of population below poverty level, median household income, and median rent price.
After data engineering multiple public datasets and testing various predictive models, I developed a multivariate linear regression model that successfully predicts Assault, Burglary, and Robbery rates with 70-80% confidence. This demonstrates a strong correlation between economic health and certain crime types. The methodology could be scaled up for business forecasting, policy analysis, or urban planning applications.
The Model
The final predictive equation I developed uses three economic factors to predict crime per capita at the zipcode level:
The Model
QUESTION
To what degree can three economic factors predict rates of each type of crime?
(Types of Crime: Theft, Burglary, Assault, Robbery, Rape, Homicide)
ANSWER
Assault, Burglary, and Robbery show a 70-80% predictive correlation with neighborhood economic factors, demonstrating they are strongly influenced by economic health. However, crimes such as Rape and Homicide show no reliable correlation with economic indicators, suggesting they are driven by other factors beyond neighborhood economics.
ECONOMIC FACTORS
% Below Poverty
Median Income
Median Rent
Crime per Capita
Where Crime = Assault, Robbery, Burglary, or Theft, and × = interaction effects
Trained Model Results
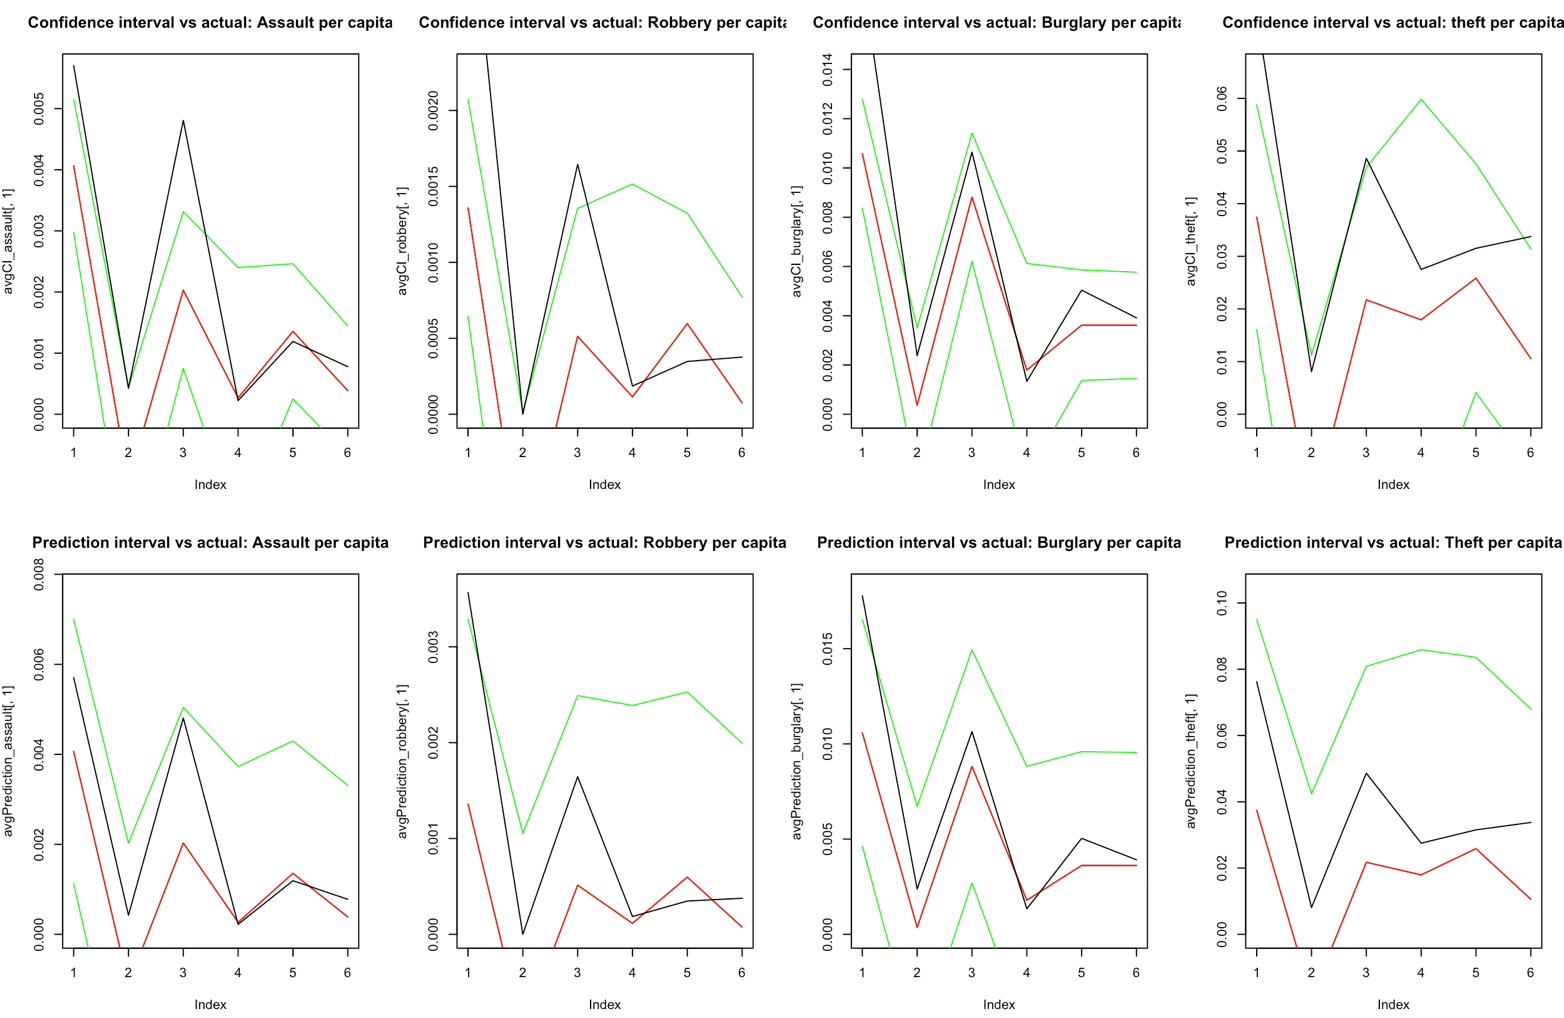
The charts below show three separate tests of the model’s predictive accuracy. Each test uses a randomly selected 80% training set and validates against the remaining 20% of data:
- Green lines = 95% confidence interval boundaries
- Red line = predicted average
- Black line = actual test data
The model performs particularly well for burglary, assault, and robbery predictions, with the confidence intervals capturing most of the actual data points.
Test 1: Model Performance
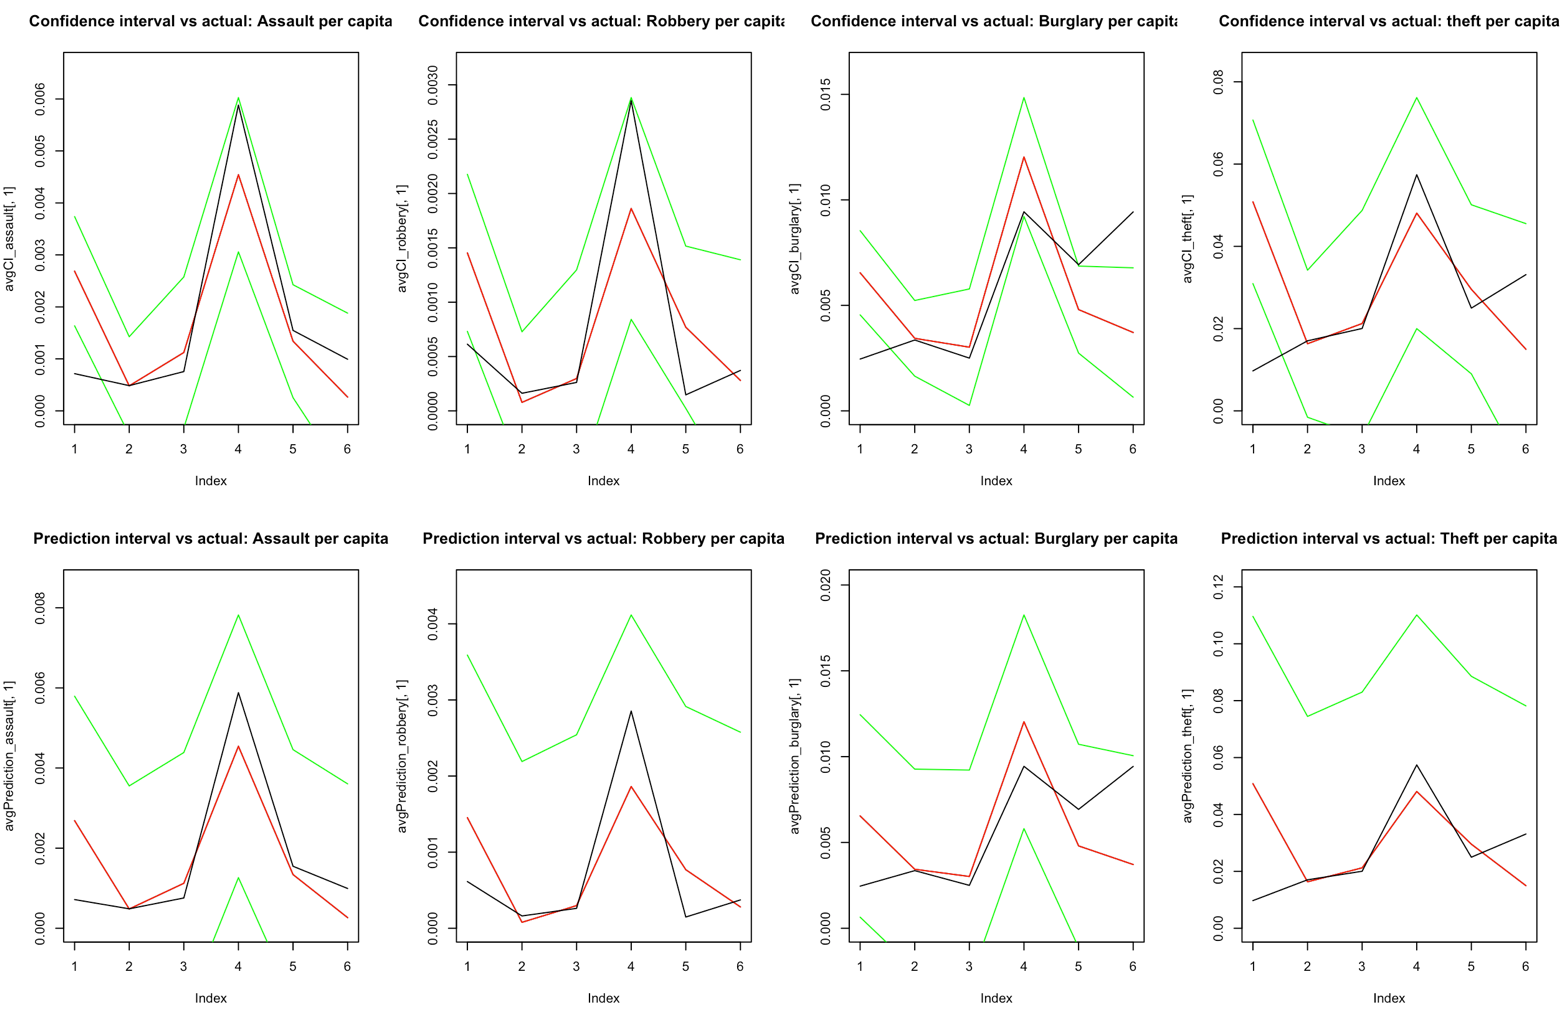
Test 2: Model Performance
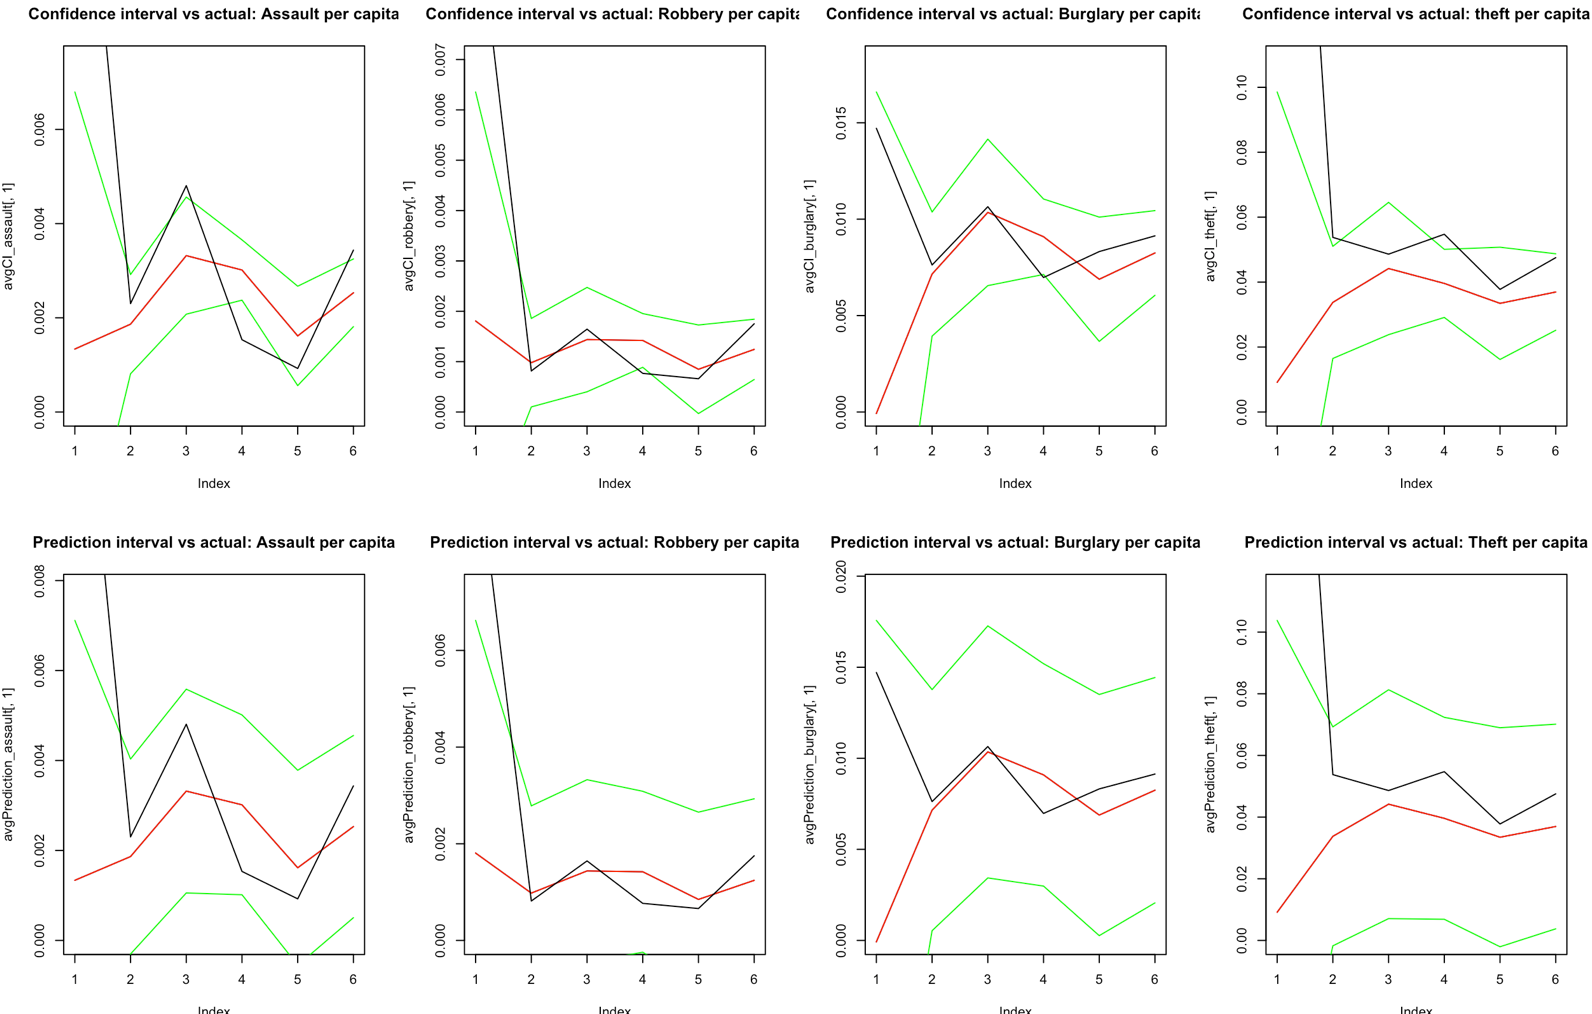
Test 3: Model Performance
How It Works
The project addresses a specific research question: To what degree can a neighborhood’s crime rates be predicted with economic factors?
Specifically, can we predict crime per capita in a zipcode using:
- % of Population Below Poverty Level
- Median Household Income
- Median Rent Price
The answer is yes—quite strongly, with 70-80% confidence depending on crime type in Austin, TX.
Data Engineering Process
I aggregated and cleaned data from multiple public sources:
2014 Housing Market Analysis Dataset (Austin Open Data): Provided economic indicators including poverty levels, median household income, and median rent prices by zipcode.
2014 Crime Dataset (Austin Open Data): 40,000+ crime records. I used regex to aggregate and standardize crime category names into six types: Assault, Burglary, Robbery, Theft, Homicide, and Rape.
2012 US Population Per Zipcode (R’s built-in library): Accessed via data(df_pop_zip) to normalize crime counts into per-capita rates.
2015 U.S. Gazetteer Geographic Data (US Census): While included in the final dataset, this geographic data didn’t make it into the final model.
The result was a clean, engineered dataset with 36 Austin zipcodes containing both economic indicators and crime statistics, allowing for multivariate analysis.
Key Findings
According to the coefficient of determination (R²) for the various models, about 70-80% of the variability in Assault, Burglary, and Robbery can be explained by the variability in the selected economic indicators. This is a remarkably strong correlation, meaning these three crime types are heavily influenced by the economic health of a neighborhood.
Interestingly, the other crime types examined—homicide and rape—showed no reliable correlation with economic indicators, suggesting they’re driven by other factors not captured in this economic model.
Model Validation
The ultimate goal was to create a statistical model from training data and then test it against held-out test data to verify its predictive power. By training the model on 80% of the dataset and testing on the remaining 20%, I could assess how well economic factors predict crime rates in practice.
The visualization charts demonstrate that the model’s 95% confidence intervals (green lines) successfully capture the majority of actual test data points (black line), with the predicted average (red line) tracking closely to reality. This confirms the model is genuinely predictive, not just descriptive of the training data.
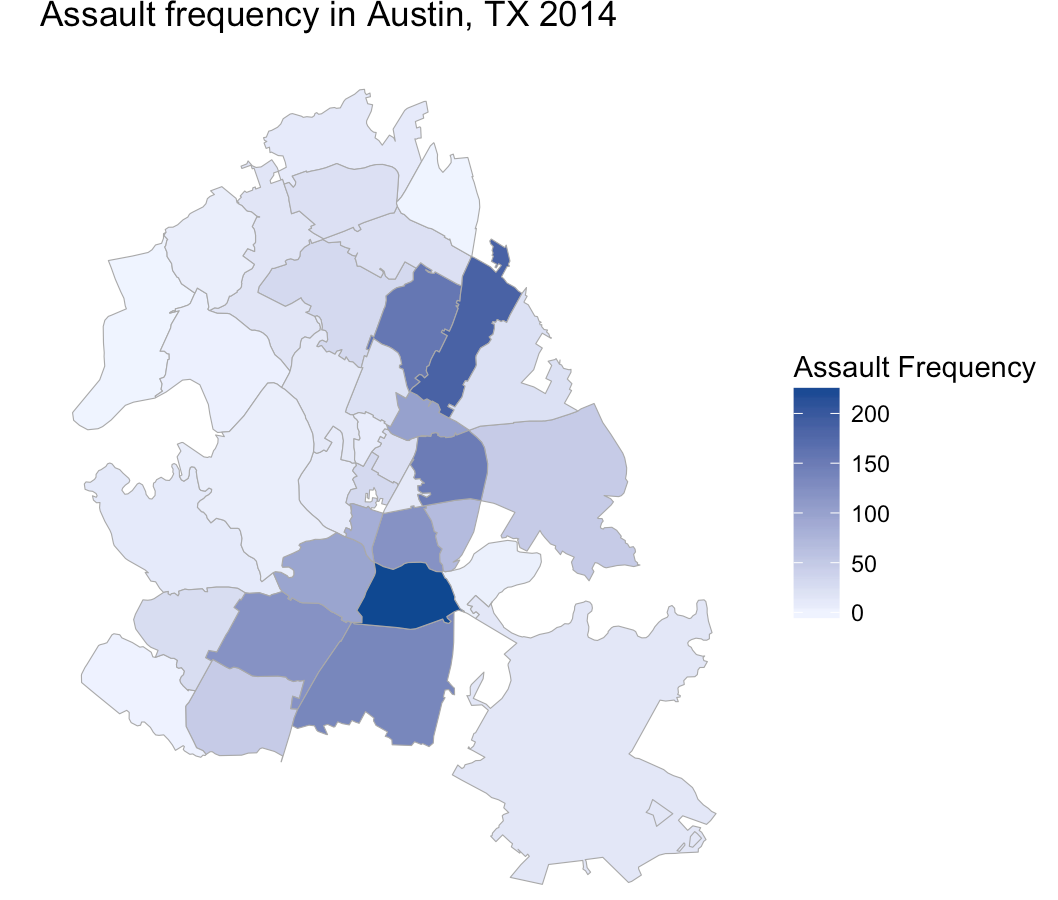
Choropleth Visualization
One of my favorite data visualization techniques is the choropleth map (heatmap). Here’s a visualization of assault frequency across Austin zipcodes in 2014:
Why Statistical Analysis Matters
I enjoy statistical analysis because it’s a creative, puzzle-solving way of thinking that allows us to explain the world through data in meaningful, measurable ways.
Throughout this statistics course, I noticed my thought processes changing. Working on this project fundamentally shifted how I approach problems—toward more analytical, data-driven, and equation-based thinking. Crafting equations from data is like solving a puzzle where you can produce real, fascinating answers from apparently unrelated datasets.
Beyond changing how you think, practicing statistics through programming improves your coding abilities. Learning R strengthened my programming skills because before analyzing data, I spent significant time understanding R’s data types and structures, knowledge that transfers to other languages and projects.
Statistical analysis with multivariate methods is valuable for empirically analyzing all kinds of questions: business decisions, scientific and engineering projects, economic theories, or policy arguments. Being able to formulate an equation or model based on data is a powerful skill.
Technologies Used
- R - Statistical computing and modeling
- D3.js - Data visualization
- Multivariate Linear Regression - Predictive modeling technique
- Public Open Data - Austin government datasets